made with Svelte
Description
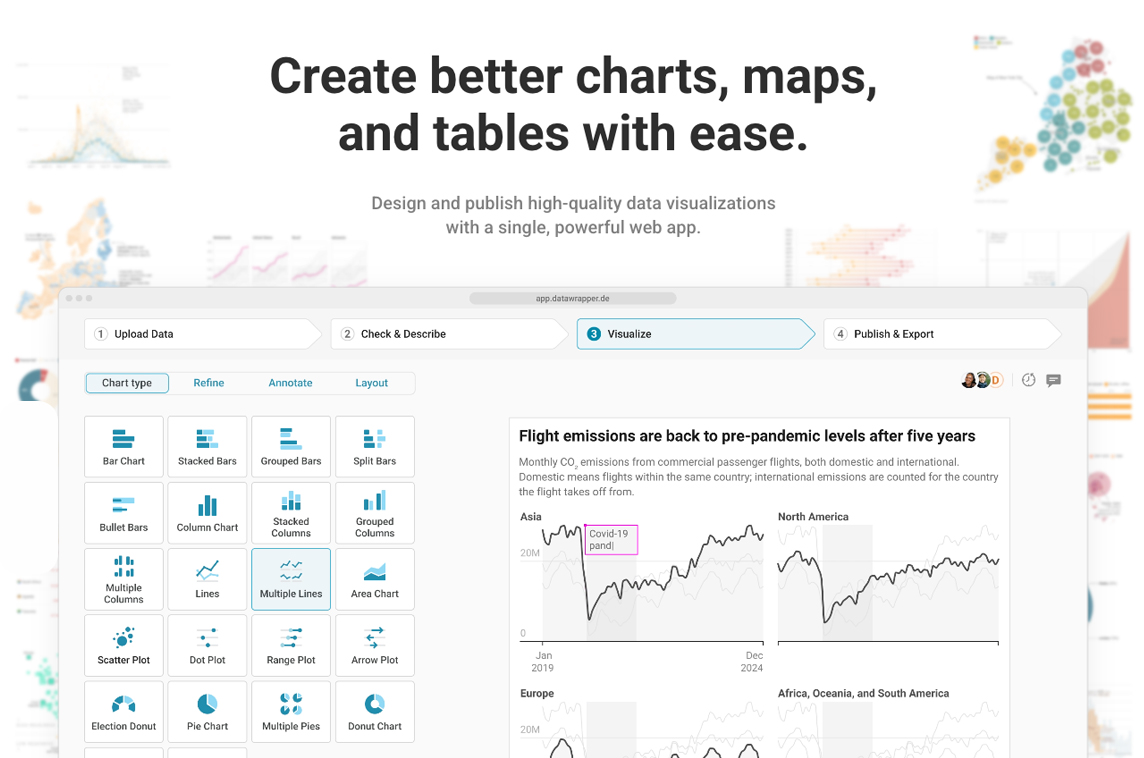
Tool to create interactive Charts, Maps & Tables
"Datawrapper lets you show your data as beautiful interactive charts, maps or tables with a few clicks - no coding or design skills required.
It provides all the features you need to create visualizations for your articles, reports, or publications.
The UI of Datawrapper and some of the visualizations are built in Svelte."

Social Media Links
ConcertMash
Spotify Playlist Generator
725
Cyfrin Updraft
Web3 Education Platform
260
Sentry for Svelte
Svelte Error & Performance Monitoring
🧡 Sponsored by Friends

We’re hosting on Digital Ocean! 💙 Try it today and get a free $100 credit.
Tutors
Open-source Toolkit for Learning Experiences
1.026
Word Peaks
Word Guessing Game